Cisco Live 2017

I’m back in San Francisco after a solid few days of conference sessions, heat, crowds, and getting to meet all sort of new faces. This year I concentrated on Nexus 9000 and VXLAN sessions as we are refreshing our TOR solution in the datacenter.

Attended Sessions

  • BRKARC-3222 – Cisco Nexus 9000 Architecture
  • BRKDCN-3020 – Network Analytics using Nexus 3000/9000 Switches
  • BRKDCN-3378 – Building Data Center Networks with VXLAN EVPN Overlays
  • BRKINI-2005 – Engineering Fast IO to the Network
  • BRKIPM-2264 – Multicast Troubleshooting
  • BRKRST-3320 – Troubleshooting BGP
  • BRKDCN-2015 – Nexus Standalone Container Networking

I also picked up a new addition to the library, Building Data Centers with VXLAN BGP EVPN.

CCNP TSHOOT 642-832 Passed

I passed the CCNP TSHOOT exam yesterday and I have to say that this exam was my favorite out of all the Cisco ones that I have taken so far. The exam format of solving trouble tickets was a welcome change that I felt was really applicable to an Engineer’s daily tasks.

The official Cisco Press TSHOOT book, Bull’s Eye exam preparation strategies, and building the official lab topology out in GNS3 helped me prepare for the exam. I did update my GNS3 version to 1.0+ and needed to convert my project files to the new 1.0+ JSON format with gns3-converter.

Blocking CDP in Junos

Cisco Discovery Protocol (CDP) is an invaluable protocol that was created to ease troubleshooting by providing remote device identification. On multi-vendor networks, the use of this propitiatory protocol can cause headaches as it may pass though non-Cisco equipment and falsely identify remote devices. We’ve instituted a standard it to use the Link Layer Discovery Protocol (LLDP) in favor of CDP.

To help clean up excess multicast traffic, we’ve applied the following filter on our Juniper devices that face Cisco equipment.

Lab Topology

Cisco Catalyst connected to an EX switch over a LACP connection. The filter gets applied to the native vlan, which in my lab testing is was vlan 1. 2014-06-11 CDP Blocking

Firewall Filter

Use the load merge terminal command to easily import the following filter. The count cdp-count term is optional and you may find that you have no use for it.

firewall {
    family ethernet-switching {
        filter block-cdp {
            term block-cdp {
                from {
                    destination-mac-address {
                        01:00:0c:cc:cc:cc/48;
                    }
                }
                then {
                    discard;
                    count cdp-count;
                }
            }
            term traffic-allow {
                then accept;
            }
        }
    }
}

Use filter counters to confirm that the filter is being hit or confirm by issuing a show cdp neighbors command on your Cisco devices.

root> show firewall filter block-cdp

Filter: block-cdp
Counters:
Name                                                Bytes              Packets
cdp-count                                            4760                   24

Cisco Live 2014

This was my first year at a Cisco Live and I was truly amazed. The caliber of the speakers, the venue, and atmosphere makes the event well worth attending.

Schedule

TECCRS-2932 — Campus LAN Switching Architecture
BRKSPG-2206 — Towards Massively Scalable Ethernet: Technologies and Standards
BRKRST-2044 — Enterprise Multi-Homed Internet Edge Architectures
PSODCT-1407 — Building Highly scalable 40/100G Fabrics with Nexus 7700
BRKARC-2350 — IOS Routing Internals
BRKRST-3321 — Advanced – Scaling BGP
BRKOPT-2116 — High Speed Optics 40G, 100G & Beyond – Data Center Fabrics & Optical Transport
BRKSEC-2003 — IPv6 Security Threats and Mitigations

Exams

CCNP Switch (642-813) *passed*

Pictures

IMG_20140519_124557IMG_20140519_123527IMG_20140522_084855IMG_20140522_084813

IMG_20140523_090902

20140522_140817

ARP Cache Poisoning

Overview

We received reports from end-users that a few client workstations on a specific subnet were experiencing around 70% packet loss when attempting to communicate between a few hosts. Since the initial report seemed to be rather isolated, we started with some basic ping tests, but as time went on and more hosts became affected, we started to escalate the issue and increasing our troubleshooting efforts.

Ping Tests

Take a look at the following ping samples from two different sources to different targets that were passing traffic on the switch in question:

-bash-4.1$ ping host1
PING host1 (1.2.3.4) 56(84) bytes of data.
64 bytes from host1 (1.2.3.4): icmp_seq=1 ttl=128 time=1.51 ms
64 bytes from host1 (1.2.3.4): icmp_seq=35 ttl=128 time=0.291 ms
64 bytes from host1 (1.2.3.4): icmp_seq=36 ttl=128 time=0.361 ms
64 bytes from host1 (1.2.3.4): icmp_seq=37 ttl=128 time=0.400 ms
64 bytes from host1 (1.2.3.4): icmp_seq=38 ttl=128 time=0.264 ms
64 bytes from host1 (1.2.3.4): icmp_seq=39 ttl=128 time=0.356 ms
64 bytes from host1 (1.2.3.4): icmp_seq=40 ttl=128 time=0.419 ms
64 bytes from host1 (1.2.3.4): icmp_seq=41 ttl=128 time=0.260 ms
64 bytes from host1 (1.2.3.4): icmp_seq=42 ttl=128 time=0.349 ms
64 bytes from host1 (1.2.3.4): icmp_seq=43 ttl=128 time=0.416 ms
64 bytes from host1 (1.2.3.4): icmp_seq=44 ttl=128 time=0.429 ms
64 bytes from host1 (1.2.3.4): icmp_seq=45 ttl=128 time=0.314 ms
64 bytes from host1 (1.2.3.4): icmp_seq=46 ttl=128 time=0.359 ms
64 bytes from host1 (1.2.3.4): icmp_seq=47 ttl=128 time=0.447 ms
64 bytes from host1 (1.2.3.4): icmp_seq=48 ttl=128 time=0.287 ms
64 bytes from host1 (1.2.3.4): icmp_seq=49 ttl=128 time=0.405 ms
64 bytes from host1 (1.2.3.4): icmp_seq=50 ttl=128 time=0.416 ms
^C
-bash-4.1$ ping host2
PING host2 (2.3.4.5) 56(84) bytes of data.
64 bytes from host2 (2.3.4.5): icmp_seq=1 ttl=128 time=1.21 ms
64 bytes from host2 (2.3.4.5): icmp_seq=30 ttl=128 time=0.484 ms
64 bytes from host2 (2.3.4.5): icmp_seq=59 ttl=128 time=0.467 ms
64 bytes from host2 (2.3.4.5): icmp_seq=83 ttl=128 time=0.197 ms
64 bytes from host2 (2.3.4.5): icmp_seq=84 ttl=128 time=0.241 ms
64 bytes from host2 (2.3.4.5): icmp_seq=85 ttl=128 time=0.210 ms
64 bytes from host2 (2.3.4.5): icmp_seq=86 ttl=128 time=0.240 ms
64 bytes from host2 (2.3.4.5): icmp_seq=87 ttl=128 time=0.171 ms
64 bytes from host2 (2.3.4.5): icmp_seq=88 ttl=128 time=0.216 ms
64 bytes from host2 (2.3.4.5): icmp_seq=89 ttl=128 time=0.194 ms
64 bytes from host2 (2.3.4.5): icmp_seq=90 ttl=128 time=0.392 ms
64 bytes from host2 (2.3.4.5): icmp_seq=91 ttl=128 time=0.240 ms
64 bytes from host2 (2.3.4.5): icmp_seq=92 ttl=128 time=0.235 ms
64 bytes from host2 (2.3.4.5): icmp_seq=93 ttl=128 time=0.222 ms
^C

The first response in both samples take a little longer than what we expected for two hosts connected to a local Gigabit switch, but falls within the profiled delay for ARP resolution. After the longer initial ping response time, all subsequent pings fall within the expected value for the local network.

The TTL values all look normal so we know the traffic isn’t leaving the local network and hitting additional hops, but take a look at the sequence numbers; they are not sequential and show a sign of a larger problem.

In the first sample, sequence numbers 2-34 were lost as were 2-29 in the second sample. We know that around 30 seconds of traffic was being completely lost in both test cases.

Find the Layer

At this point we could rule out a Layer 1 issues so we knew there was no issue with our optics being dirty or the input/output queues on any of the switching equipment.

There had to be a Layer 2 issue, which could include bridging, MAC address learning occurring on different pieces of equipment at different times, competition for an IP, or ARP poisoning.

As more time passed, more workstations started to notice more loss of traffic on the network. All signs pointed to something wrong with the ARP table. A show mac address-table command on one of the switches showed that a number of hosts were associated with a MAC address of 00:00:00:00:00:00 and that number was increasing over time.

Wireshark

After getting a SPAN port on the switch and looking at traffic with Wireshark, we found a large number of responses to ARP requests with a value of 00:00:00:00:00:00 for hosts in the local subnet that were all sourced from one machine. This one computer was poisoning the ARP cache on the network with all zeros, causing the location for every host to eventually become a blackhole for traffic.

As more ARP caches on end-user machines and switching equipment were timing out, they were sending out new ARP requests and getting poisoned information. Once the offending machine’s port was shut down, we started to notice traffic return to normal.

Catalyst Spring Cleaning

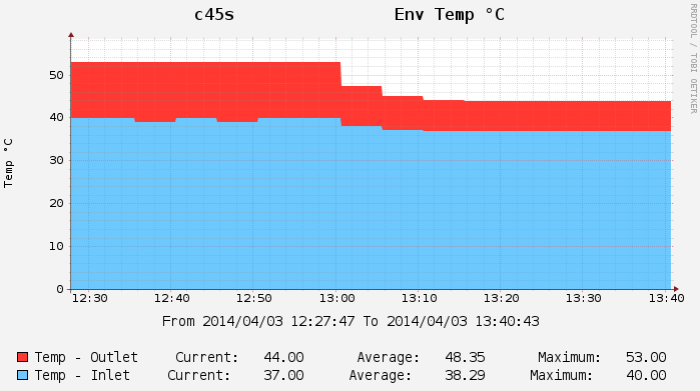
Don’t forget to remove dust from the inlet ports on your Catalyst 4500 chassis on a routine basis if they exist in locations where they are exposed to large amounts of particulates. You don’t want to be woken up at 6:19AM by a downed device.

Mar 18 06:19:40 1.2.3.4 : %C4K_IOSMODPORTMAN-2-MODULESHUTDOWNTEMP: Module 1 Sensor air outlet temperature is at or over shutdown threshold - current temp: 86C, shutdown threshold: 86C
Mar 18 08:25:23 1.2.3.4 : %C4K_IOSMODPORTMAN-2-MODULESHUTDOWNTEMP: Module 1 Sensor air outlet temperature is at or over shutdown threshold - current temp: 86C, shutdown threshold: 86C.
Mar 18 09:34:49 1.2.3.4 : %C4K_IOSMODPORTMAN-2-MODULESHUTDOWNTEMP: Module 1 Sensor air outlet temperature is at or over shutdown threshold - current temp: 86C, shutdown threshold: 86C

Sadly the Syslog events never made it to our central repository. Our solution for the first automated shutdown was to simply power the device back on to enable connectivity for the building. After two more instances of shutting itself off, we reviewed the logs on the local device and discovered that they never reached out syslog server.

A simple wipe of accumulated dust saw our temperature take a drastic drop.

2014-04-03_dust